2025 v1.0
The Quarterly Bulletin is the first draft of economic history. It reminds us that 2025 was better but not great.

When I was a young enthusiastic economist, the release of the Quarterly Bulletin, or “the QB” was a major event. The Treasury would send a messenger from our building to the Reserve Bank, just a few blocks away. He would come back with a box of brand new QBs. As the juniorest flunkey, it was my job to read the thing and prepare a little note for Minister Manuel. Annoyingly, by the time I had finished my note, he had usually read the thing from start to finish and already had thoughts. I think he got an advance copy, or the Governor had told him all the salacious stories about the change in inventories over dinner the night before.
Then, the QB was big news. It contained the GDP estimates, the current account and all the cross-border financial activity data… sometimes even some research articles, and if we had all behaved ourselves, and managed to not tear open the box in our excitement, there would be a treat… a technical note on an arcane statistical matter! (Here is one on the new labour statistics). All manner of things that make macroeconomists excited. We’re an easy bunch to excite. And the apex one was the March QB because it contained (wait for it) the annual estimates of everything. Quarterly and Annual. In one place! Glory be, I need to sit down and have a cup of camomile tea to calm me myself down.
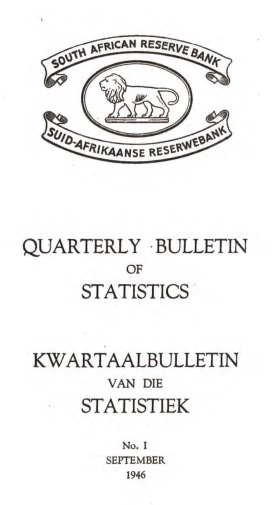
The QB is the oldest and grandest of Reserve Bank publications, and it has been with us since 1946. The foreword to the first one promised that it would be expanded over the years. Today it stretches to 318 pages. This is 122 pages of economic analysis; and 166 pages of statistical data. If you want to read a summary of how it has all been done since 1946, then this really great publication is for you.
But it is no longer deemed newsworthy. While it still contains a treasure trove of interesting information, by the time it comes out, all the big stories have been told. All the GDP estimates now come out from StatsSA a few weeks earlier, the current account figures are also released ahead of time, as are the labour market figures, the inflation numbers, and so forth. Also the QB’s Economic Review is the longest, but hardly the only, summary of the global and domestic economy. Even the SARB creates competitors: the Monetary Policy Review, which summarises the global and domestic economy, the Financial Stability Review, which summarises the global and domestic economy, the multitude of Annual Reports for various parts of the Bank, each of which summarises the global and domestic economy, and the Monetary Policy Statements, which summarise the global and domestic economy. The SARB probably generates over two thousand pages of economic analysis a year. But, the source of almost all of it is the QB. (Perhaps the new Chief Economist will apply his or her mind to sending us fewer documents to read, and I would keep the QB.)
But this does not render the QB obsolete. And it still deserves to be carried in the news. If anything, the March QB retains the crown. It is the first time we get all the pieces of 2025 put together in one place. It is, if you like, version 1 of the story of 2025. A 318 page long story, but a story nevertheless. The statistical tables are the basis for every graph every economist draws for every presentation.
So here I go with my summary: Five Fun Facts About 2025 from the Quarterly Bulletin.
All the data is available at the Bureau for Economic Research’s DataPlayground. But the best way to understand the QB is actually to download it. I don’t know how to get a printed copy anymore. Maybe someone will send me one via carrier pigeon to Stellenbosch.
Fun fact 1: Long-run average growth has been 3%
We now have 80 years of QB economic growth data, from 1946 to 2025. Growth averaged 3.03% a year. In the post-Apartheid era, the best decade was 1996 to 2025, with growth of 3.3%. Excluding the COVID contraction makes the 1986 to 1995 decade the worst (1.3%), and the most recent decade the second worst (1.5%).
Of the last 80 years, 44 of those years saw growth of 3% or more, and 17 years saw growth of more than 5%.
We have only experienced 10 years of zero or negative growth, and one of those years was COVID. That’s 70 years of growth, at an average pace of 3%. It starts adding up.
The fastest post-Apartheid year was 2006, where annual growth touched 5.6%. Between 1994 and today, just under half of all years have seen growth of over 3%. All of those were before 2011 (excluding 2021 which was a weird post-COVID bounce).
So yes, I think we can get growth back to 3%.
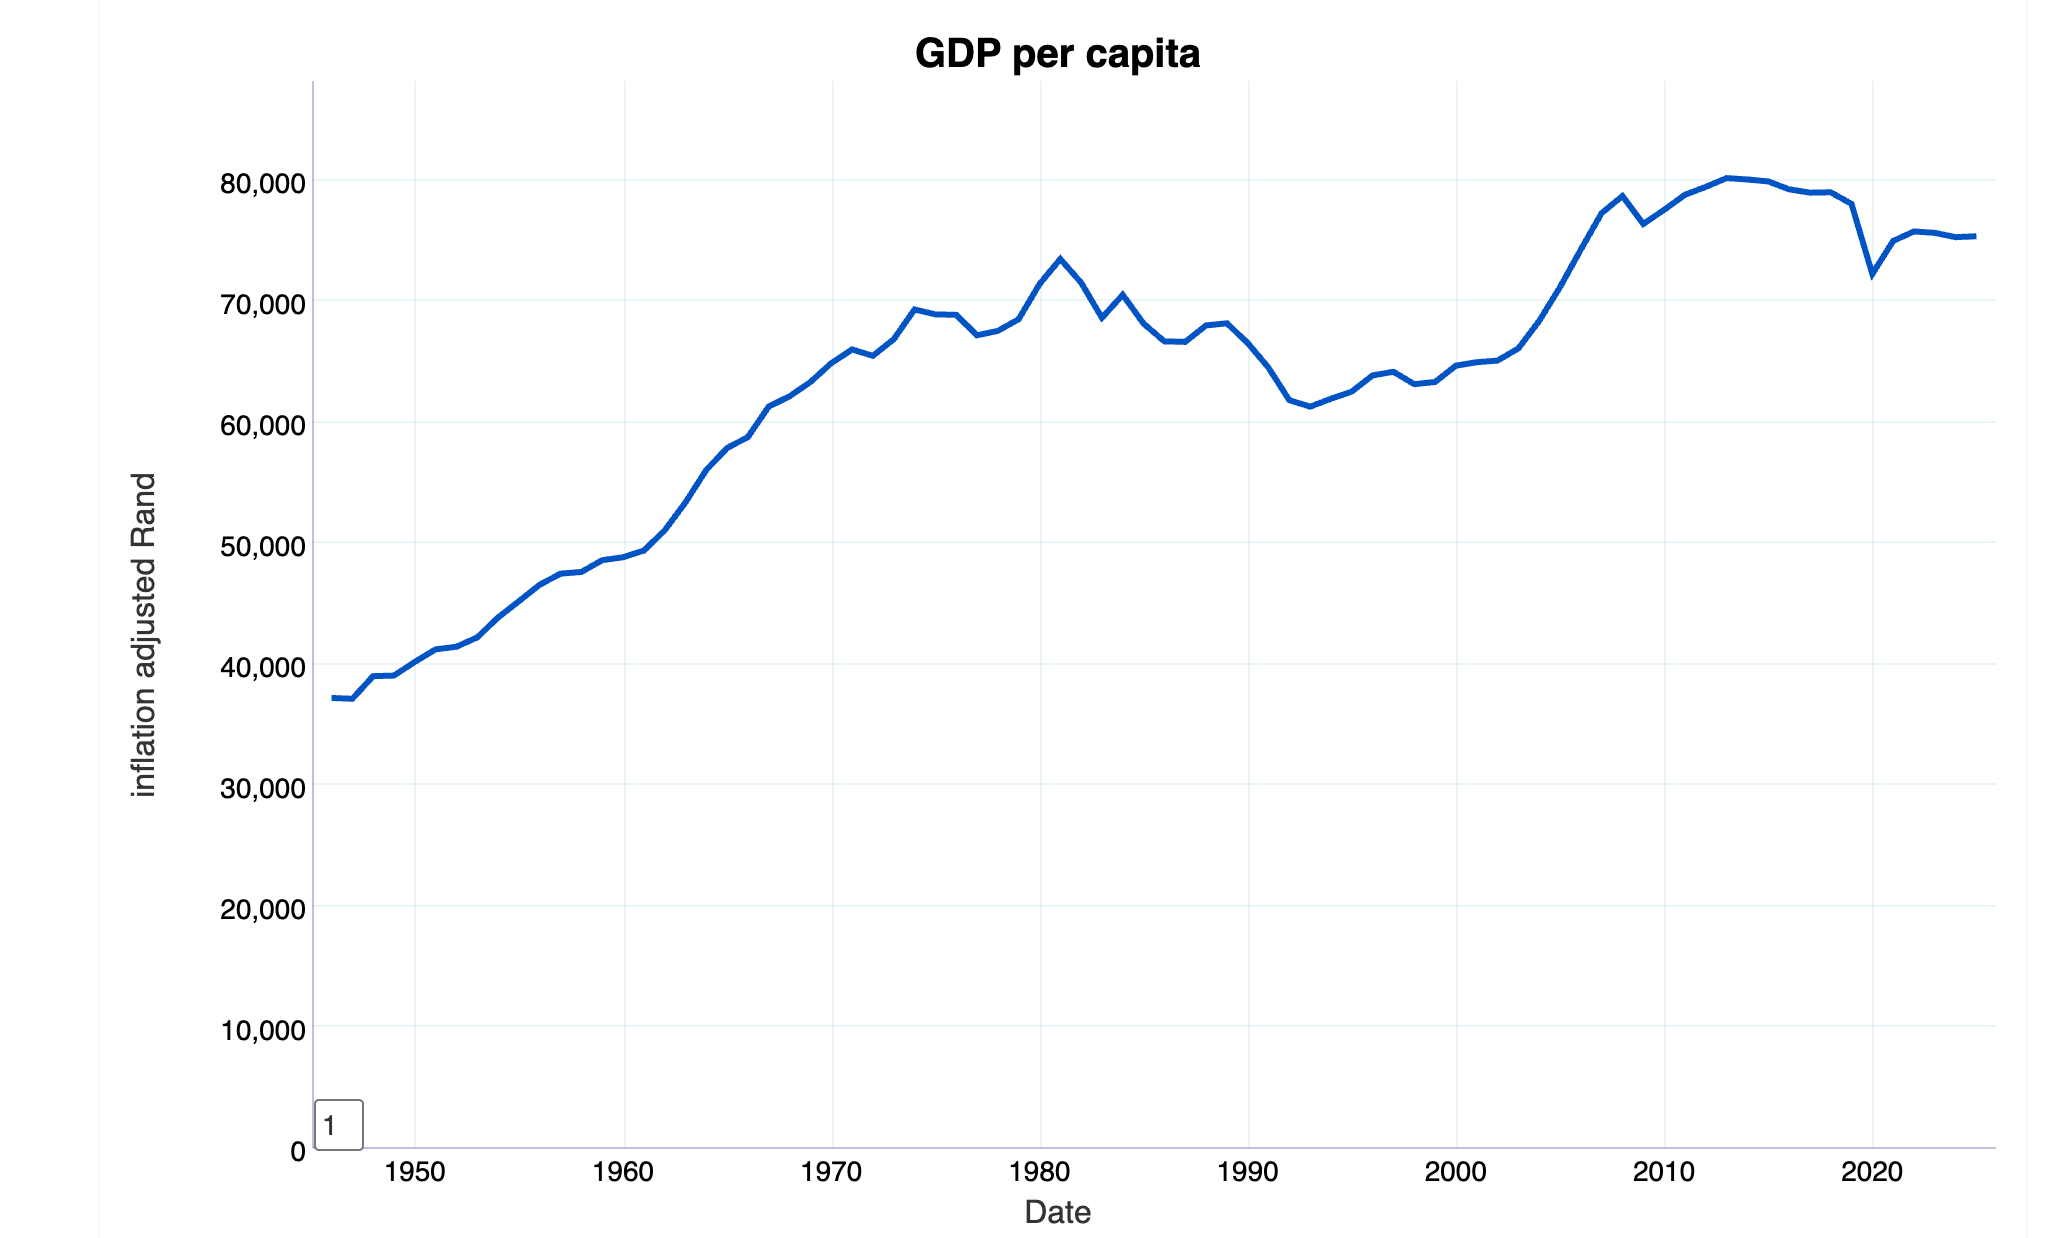
Fun fact 2: GDP per capita has stagnated
The QB provides the first official estimates of GDP per capita. It rose by 0.1% in inflation-adjusted terms between 2024 and 2025, which is pretty much nothing. In nominal terms, it is now R122,140 or R10k a month. The SARB doesn’t publish a population estimate, but its not difficult to get it from the GDP per capita figure. Their population growth estimate is 1.0% and they have the population at 62.6 million. This is half a million less than than the 2025 StatsSA mid-year population estimate of 63.1 million, but what’s a half a million people between government agencies? (StatsSA has population growth at just above zero).
The average citizen is 6% poorer than in 2013, which is when we were the richest we have ever been. At an extraordinarily prescient piece of writing, Stephen Grootes described that year it as the Great Splintering, as the post-Manguang ANC began to collapse. Madiba also passed away that year.
If you want a fun fact for dinner parties: in the roughly twenty years between Mandela becoming President (April 1994) and the year that he passed away (December 2013), the average South African became 30% richer. We have only become poorer since. Maybe we should ask him for a macroeconomic policy strategy?
And who has been the worst President by this metric? PW Botha. Between 1981 and 1987, per capita GDP contracted 9.3%, and between 1981 and 1993 it shrunk 15.7%. GDP per capita in 1994 was equivalent to that of 1968.
Current GDP of R10,000 a month might sound a lot. It does, of course, mask enormous variation.
The IMF compares countries,1 and in 2026, they reckon we are the world’s 107th richest country, coming in at US$6,835 (or R116,000 a year or R9700 a month). This is less than half the world average (US$14,217, which is around R240,000 a year or R20,000 a month).
Yes, read that again. The average GDP per person in the world (including everyone from the richest in Liechtenstein to the poorest in South Sudan is around R20,000 a month, and our average GDP per person is R10,000 a month. Maybe we should try be average.
Fun fact 3. Investment growth is negative
See what I did there? I wrote something down that makes no sense, and you didn’t even notice. Growth can’t be negative. If growth is negative, that is economese for shrink. Investment shrunk. We invested less in 2025 than we did in 2024.
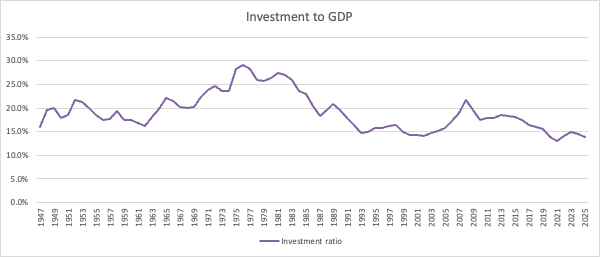
Hidden on page 24 of the Quarterly Review is this fun fact, written in that typical SARB understated way: “As a result, the ratio of nominal gross fixed capital formation to nominal GDP decreased further from 14.5% in 2024 to 13.9% in 2025.” Here is a graph of the investment ratio back to 1946. Excluding COVID, 2025 was the worst year ever.
Fun fact 4: Fun fact 2 and fun fact 3 are related
I doubt this comes as a surprise, but our GDP per capita stagnation is arguably largely due to our investment stagnation. Not only has investment stagnated, but it has also become less productive. I sommer wrote a whole paper about this for the ERSA Growth conference (available here). Fortunately you don’t have to read the whole thing as Carol Paton summarised it much more deliciously than I could: It’s the politics, stupid! Why SA can’t create jobs: A combo of weak demand, too much government debt, lack of policy certainty and too much regulation.
Fun fact 5: The bond and equity market
We can’t leave out the equity and bond market. 2025 was quite the year.
The first point of interest is that the QB pulls together the listings information on the JSE, A2X markets, the Cape Town Stock Exchange and the Integrated Exchange (previously Equity Express Securities Exchange). A2X does secondary listings, so isn’t necessarily a source of new capital raising, but clearly there is stuff happening on the Cape Town Stock Exchange. It now has a market capitalisation of R7.3 billion, although one company (NV Properties, which owns the Premier Hotel group) accounts for R2.6 billion. Other fascinating companies on the CT Exchange include a Mohair and Sheep company, a renewables company and a Northwest farming company, and one that operates across South Africa.
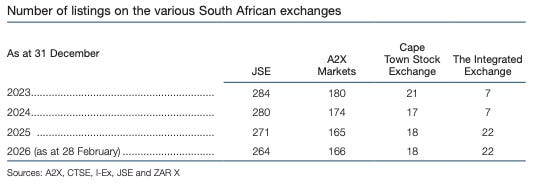
These are the sorts of small and medium enterprises that the JSE doesn’t attract (nor is trying to attract?). The QB even sniffly notes (on page 90) that: “The number of listings on the JSE also declined in 2025, following 16 delistings and 7 new listings, as some small to medium-sized companies found the compliance and administrative costs of being listed on the JSE too high. In response, the JSE launched simplified listing requirements on 13 January 2026, aimed at reducing the complexity and compliance costs of listing and to encourage new listings.”
Of course, that is not the big story of 2025. It is in this paragraph which is how many will remember 2025 (and should have / would have / could have sold on 27 February 2026, before Trump did his thing in Iran). Bold is my excitement.
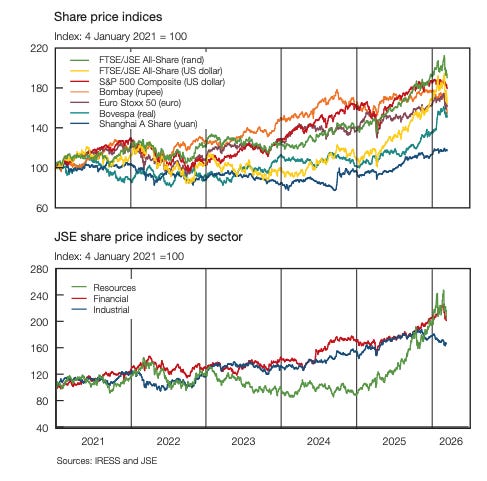
“The domestic share market performed exceptionally well in 2025, with the Alsi, in rand terms and on balance, surging by 37.7% – its best annual performance since 2005. The Alsi surpassed the historic 100 000 index-point milestone for the first time on 23 July 2025 and reached 115 832 index points on 31 December. In US dollar terms, the Alsi rose by 55.3% in 2025, significantly outperforming its emerging and developed market counterparts. … The Alsi extended its gains into early 2026, reaching an all-time high of 128 456 index points on 27 February, supported by the stronger precious metals and mining share price index within the resources sector. Following this peak, the Alsi corrected rapidly by 10.5% to 114 924 index points on 13 March as the war in the Middle East weighed on the performance of global share markets.”
This busy line graph is the story - the FTSE/JSE All Share in US dollars has pretty much outperformed everyone.
Curiously, this was not (what I thought) because of inflows into the JSE from offshore. To quote: “Non-residents’ net sales of JSE-listed shares increased to R219 billion in 2025, up from R145 billion in 2024, according to JSE data.”
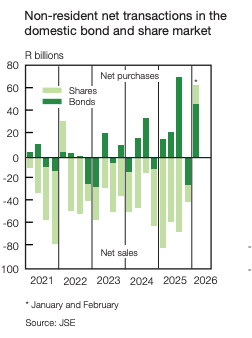
So despite foreign sales of JSE shares, the JSE jumped. This leaves only domestic players as the buyers in 2025. But the story changes in the first part of 2026, with the QB noting that: “… this trend reversed as non-residents recorded net purchases of R17.3 billion in the first two months of 2026… [meaning that the share of non-resident holdings of JSE-listed shares increased to 32.9% in February 2026”. Of course, the QB was finalised in mid March and all the analysis ends quite dramatically thereabouts, despite Trump not finalising anything on his side.
So that’s a wrap. Five fun facts: Stagnating GDP per capita, growth below its long term trend, investment down, but the stock market is booming? Is that a leading indicator that we have turned a corner? What will happen to our dear country next? Are we going to have a strong start to 2026 or will the Middle East derail everything?
We’ll have to wait for the next QB to find out.
I told you it’s an exciting publication.
This is nominal terms, which is also what the SARB QB reports. (So it is an apples-to-apples comparison). If you use the IMF purchasing power parity data, then per capita South African income is US$16,283, or about 2.5x the nominal amount. That said, we don’t change much on ranking. In nominal terms we are 107th richest in the world, and in PPP terms we are 108th. World PPP GDP is US$25,591 or about 1.5x ours.
Thanks Roy. Interesting insights about the changing role of the QB. In the good old days I remember having to transcribe columns of numbers into spreadsheets. I don't think you have to do that anymore.... BTW, in the first line of Fun Fact 1 there seems to be a typo--your dates don't specify a decade.
I loved this column! I certainly remember the excitement at each new release, quickly followed in the mid 90s by a phone call from Ben Smit to talk about the best bits. I had a full set from 1994 to 2004 but finally pulped them when I left Stellies.